
Data Visualization Portfolio
Developed in MICA Master’s in Data Analytics and Visualization
Capstone Project:
Perpetuation of Privilege

The culmination of the MICA Master’s in Data Analytics and Visualization is the development of a capstone project and presentation (below). Inspired by Malcolm Gladwell’s Revisionist History podcast, this data journalism story calls into question the popular U.S. News & World Report Best Colleges ranking system.
Using data reported by U.S. News and the government-sponsored Integrated Postsecondary Education Data System (IPEDS), this story visually displays the gaps and suspicious trends in the U.S. News Best College rankings, seeking to educate parents and students who believe the rankings measure quality, while providing alternative data sources and ranking systems for considerations.
The full project can be found at tinyurl.com/PerpetuationOfPrivilege

Tableau Public
Click the link above to see my Tableau Public portfolio.
Static Visualizations
-
![]()
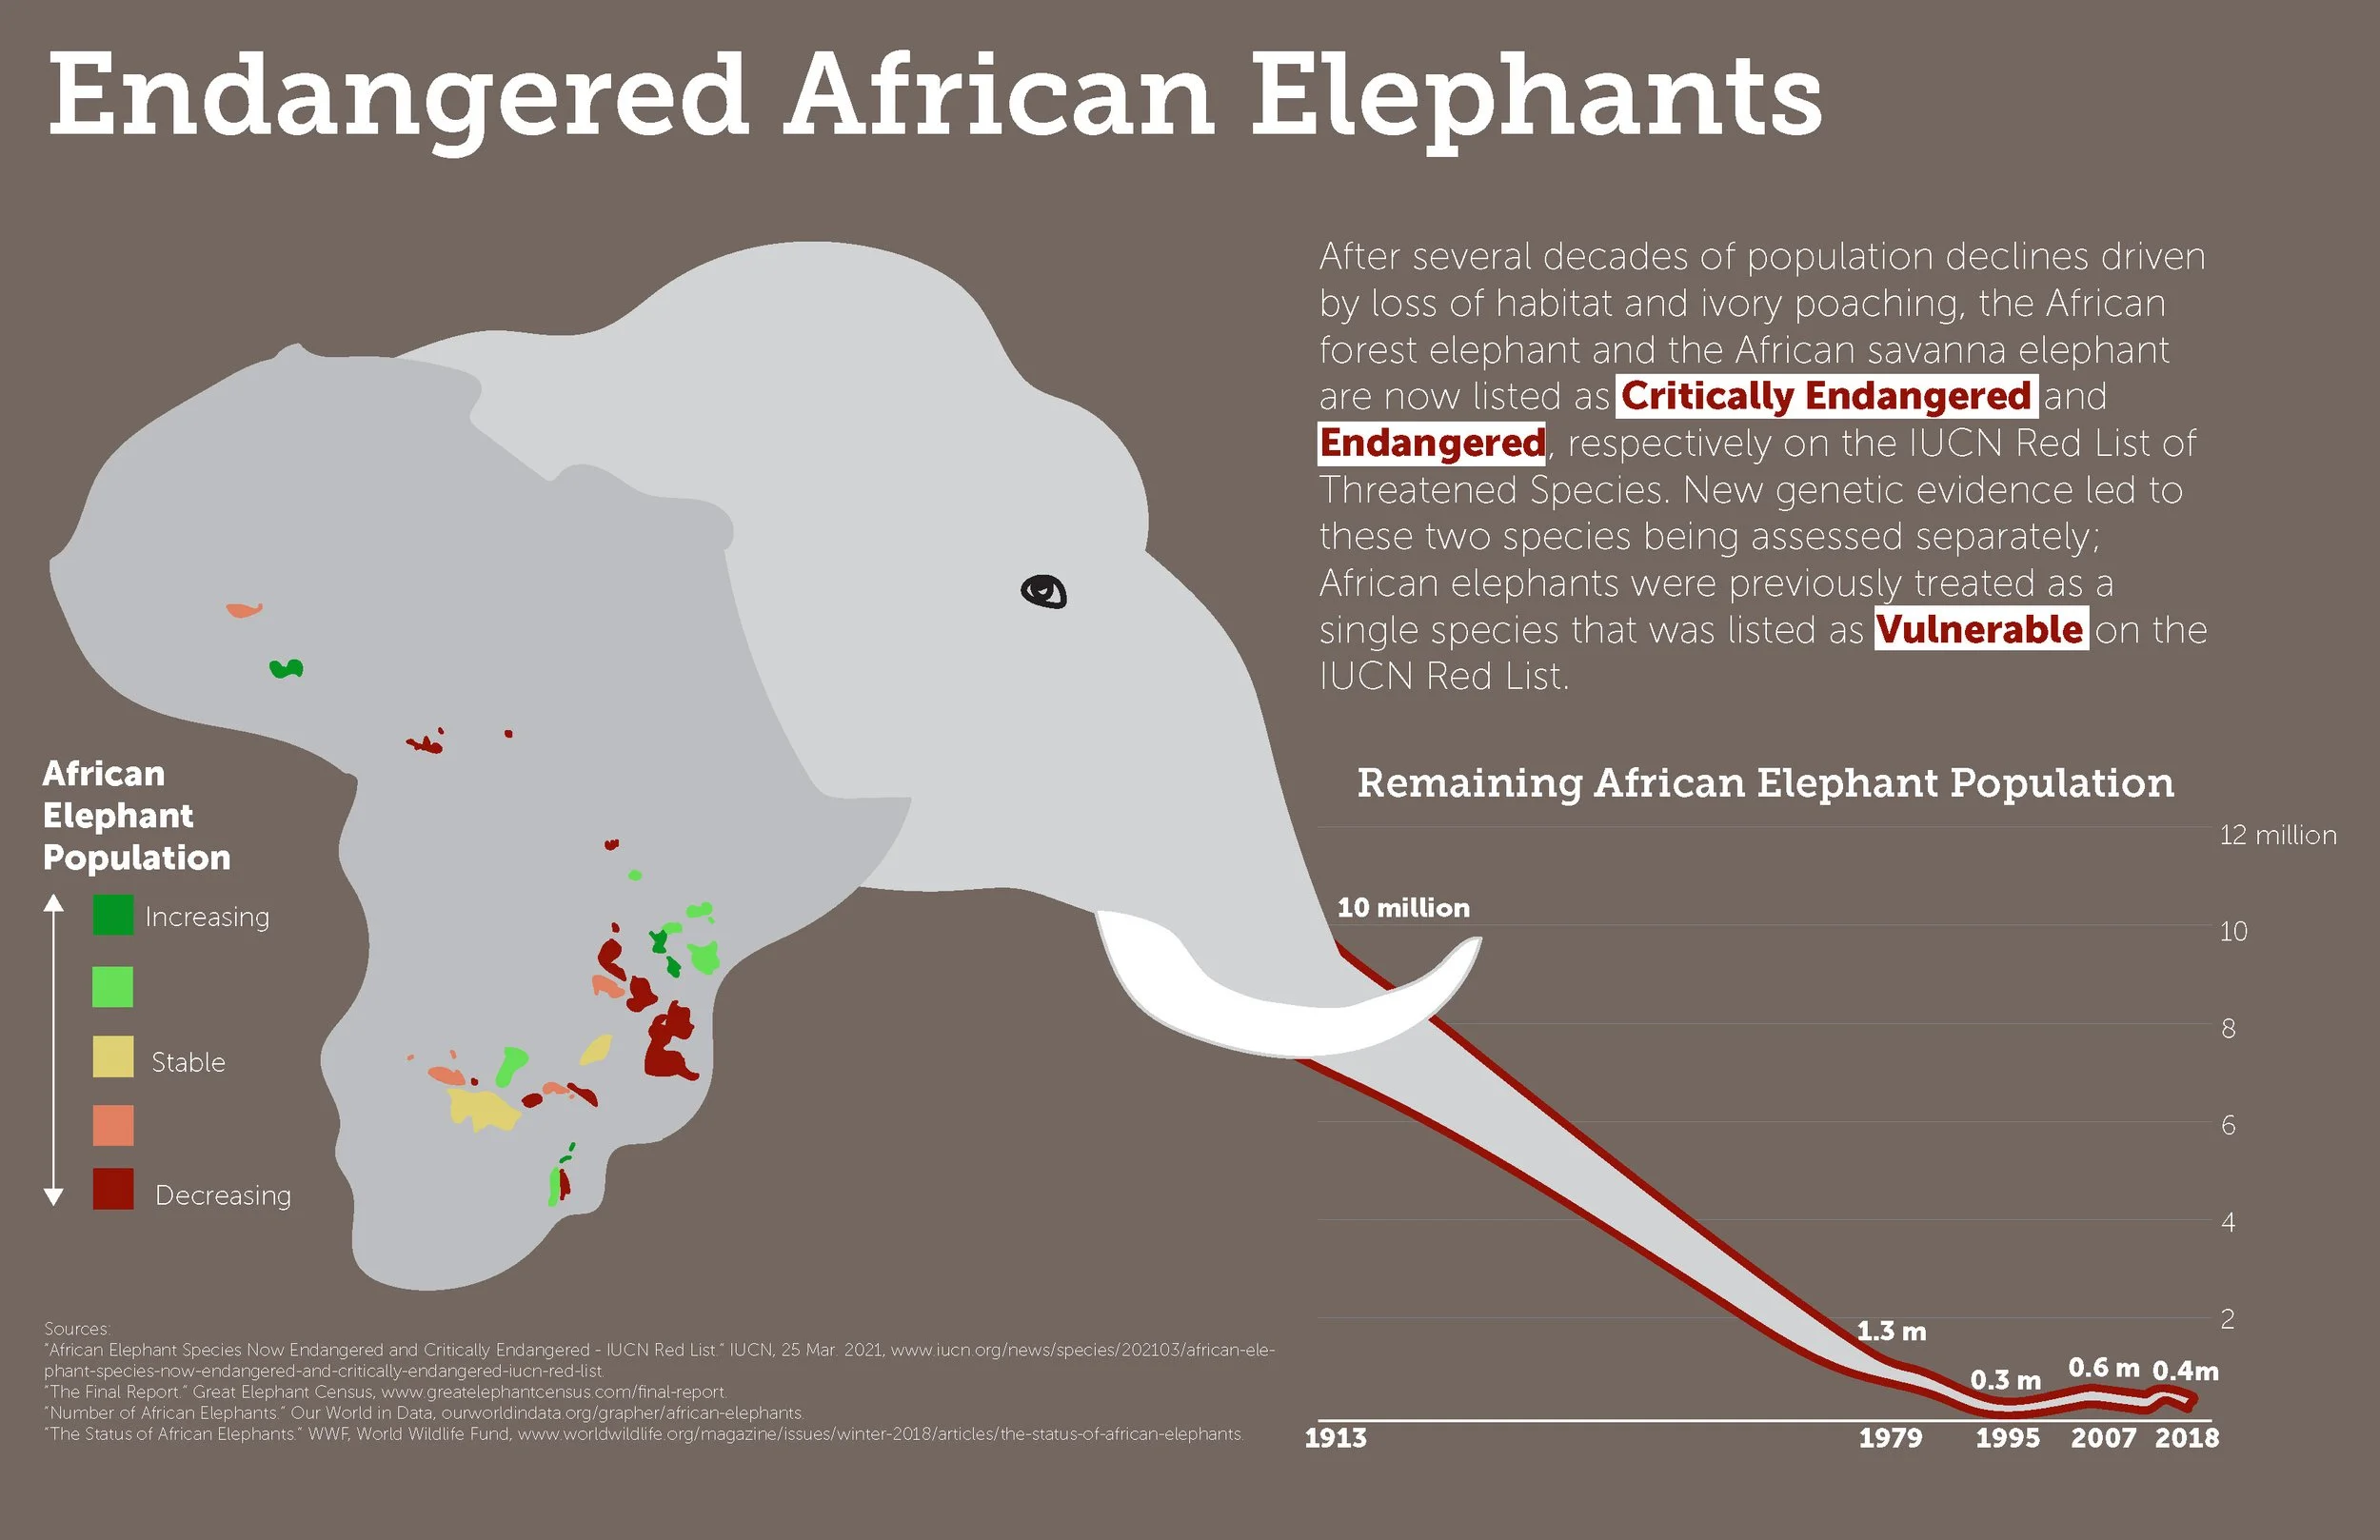
African Elephants
Assignment: Design an information graphic that employs at least three feature channels to consciously attract our attention and create a strong visual structure. Use feature channels to deliver at least 5 key pieces of information about endangered species, such as where they are endangered, which animals are most endangered, why (the causes) of endangerment, etc.
-
![]()
Gender Wage Gap
Assignment: Conceive, organize, and build a data visualization that effectively illustrates the social inequity of the gender wage gap.
-
![]()
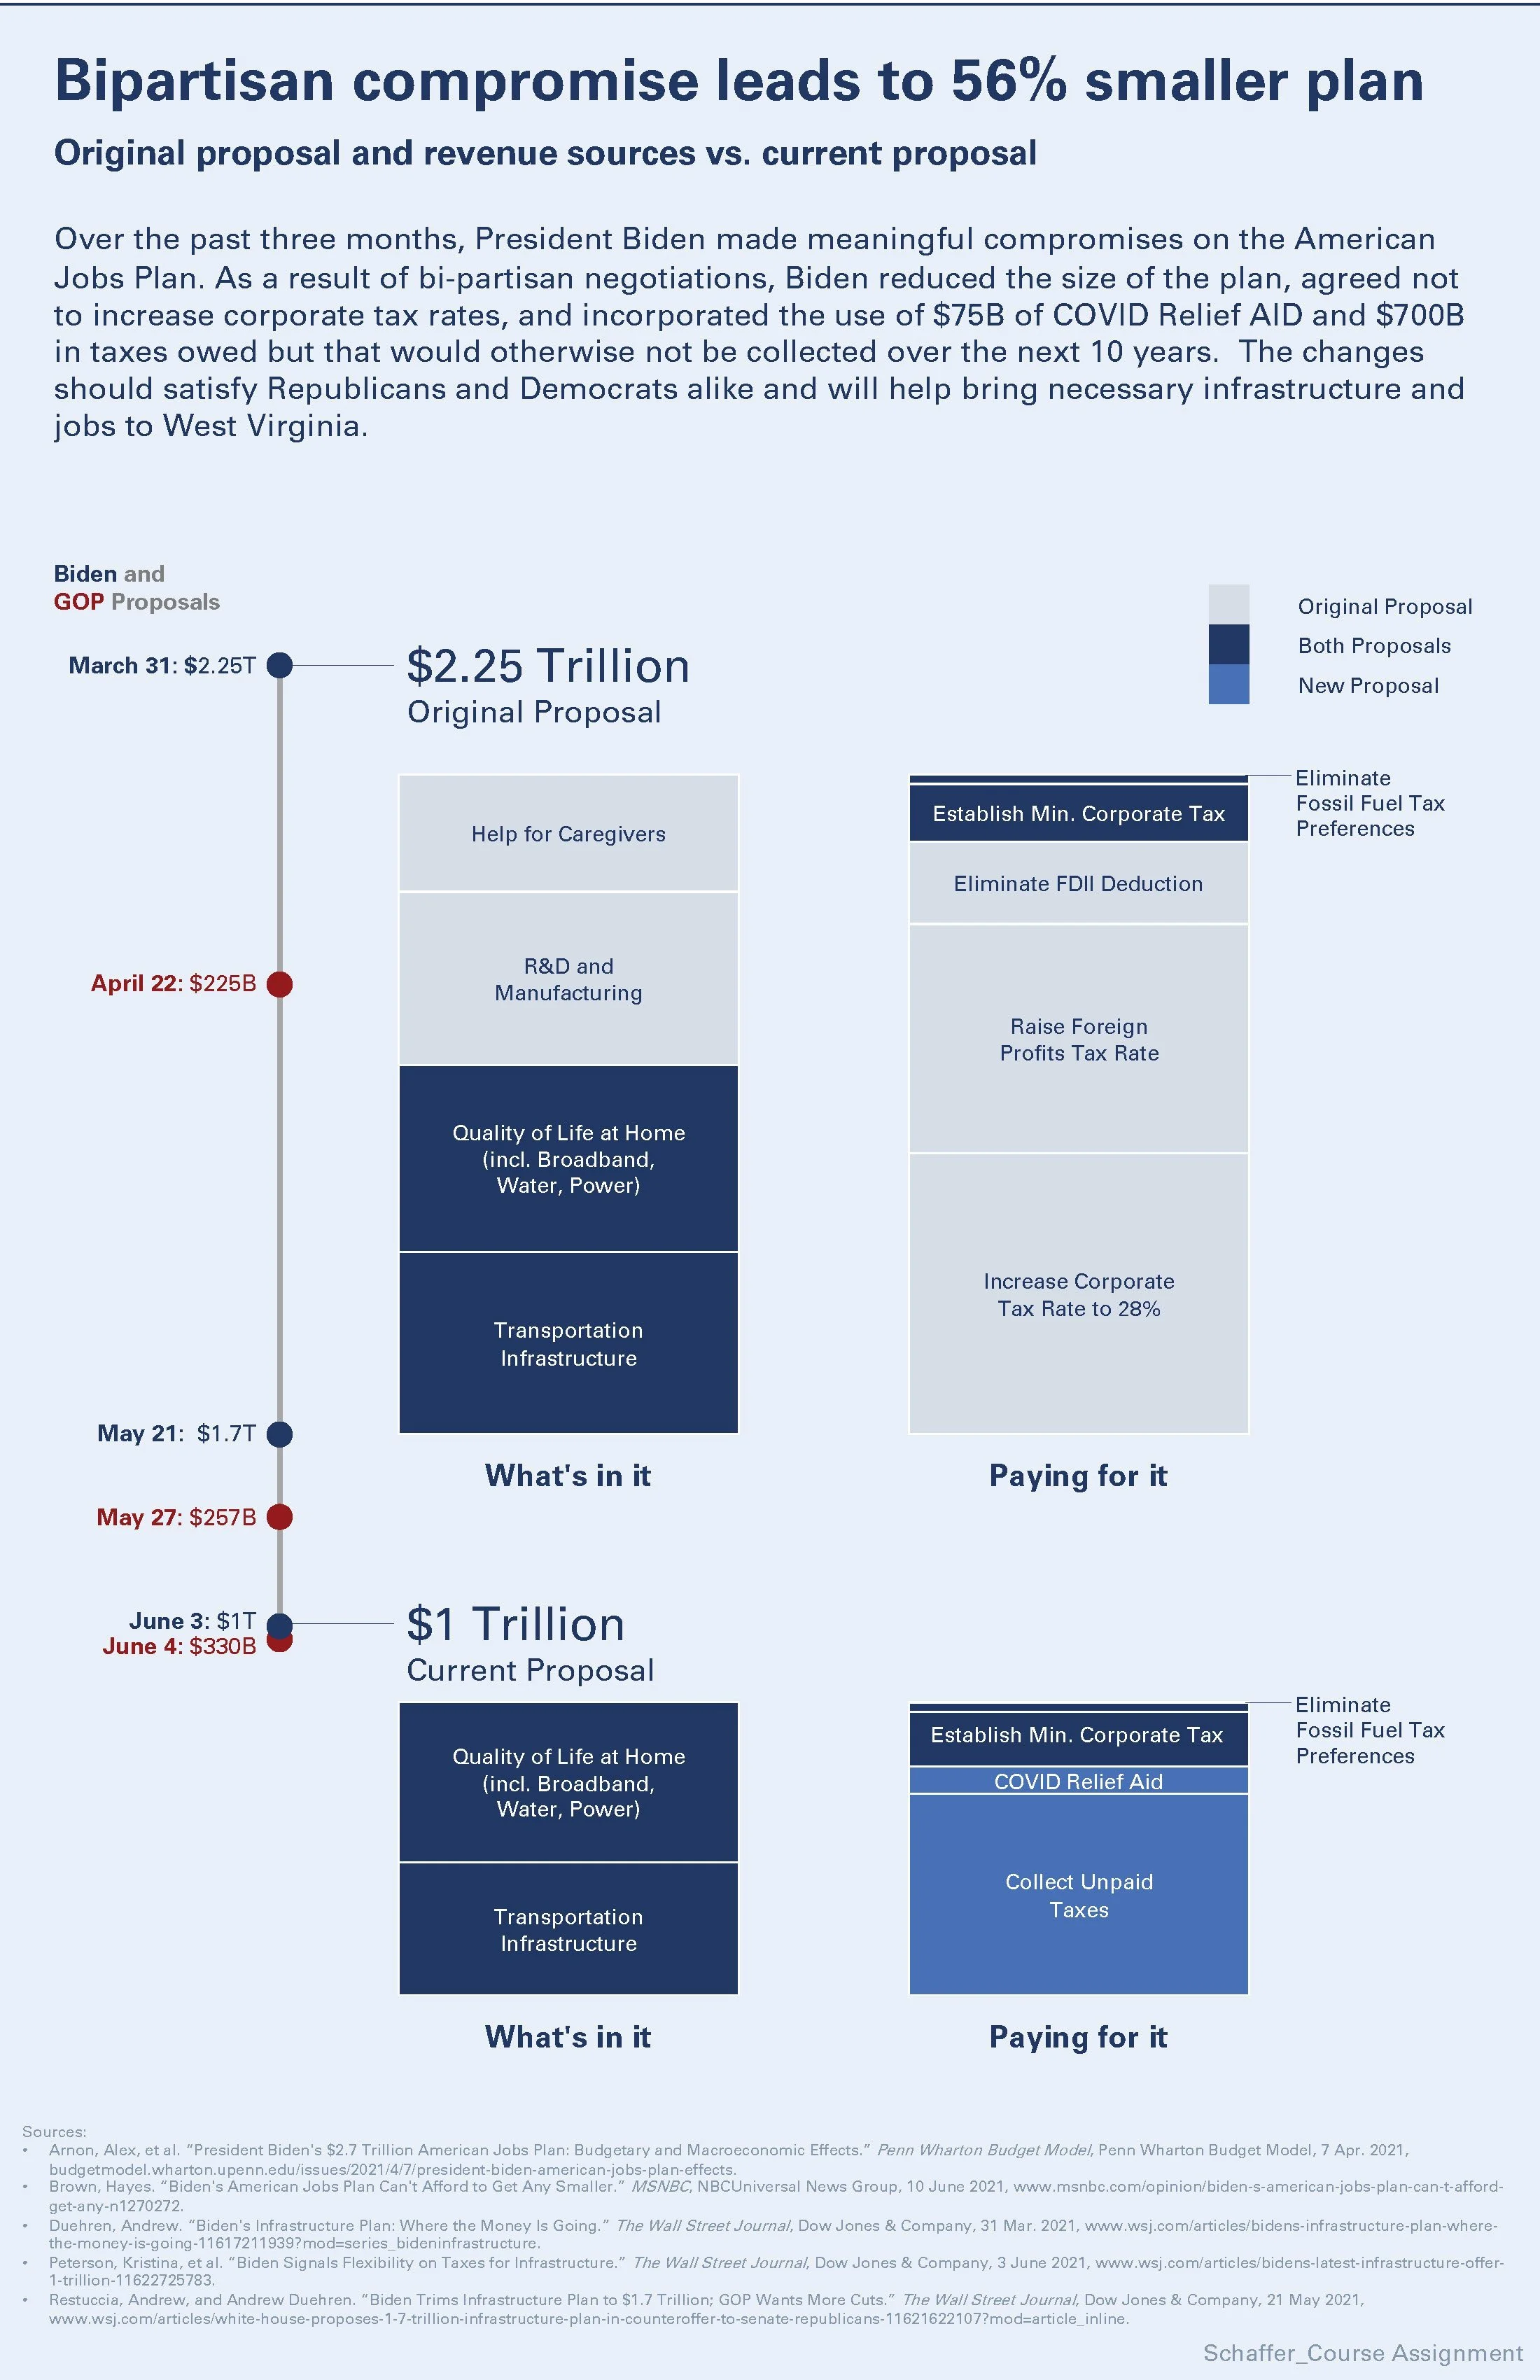
Infrastructure Bill
Assignment: Democrats have won the White House and have majorities in the House and Senate, but they’ve had trouble passing some major pieces of legislation due to one reluctant member of their caucus in the senate. Senator Joe Manchin, a moderate Democrat from West Virginia, has refused to go along with his party’s efforts to pass ambitious legislation like the American Jobs Plan (infrastructure bill). Persuade Senator Manchin to support President Biden’s American Jobs Plan infrastructure bill using data visualization.

Illustrations